This lens has no calibration data.
This lens has no focus data.
Focus Shift
The focus shift information shows how the point of best focus changes across the aperture range.
Wide Performance Score 70mm | |
Wide Performance Score 200mm | |
The wide information shows the performance of the lens when wide open. The measurements are comparisons with the values at the aperture of best image quality, and include measurements of quality, astigmatism and colour-specific quality.
Summary
The summary information shows the metrics measured to build the score.
| 70mm | 200mm |
|---|
| Aperture Stops (Wide to Peak) | 0.3 | 0.6 |
| Wide Quality Change (vs best IQ) | -2.9% | -6.3% |
| Astigmatism (wide) | 1.2% | 1.6% |
| Wide Astigmatism Change (vs best IQ) | +0.5% | -0.1% |
| Red Quality (wide) | 99.2% | 99.4% |
| Wide Red Quality Change (vs best IQ) | +0.2% | -1.0% |
| Blue Quality (wide) | 96.0% | 96.7% |
| Wide Blue Quality Change (vs best IQ) | -1.3% | -0.5% |
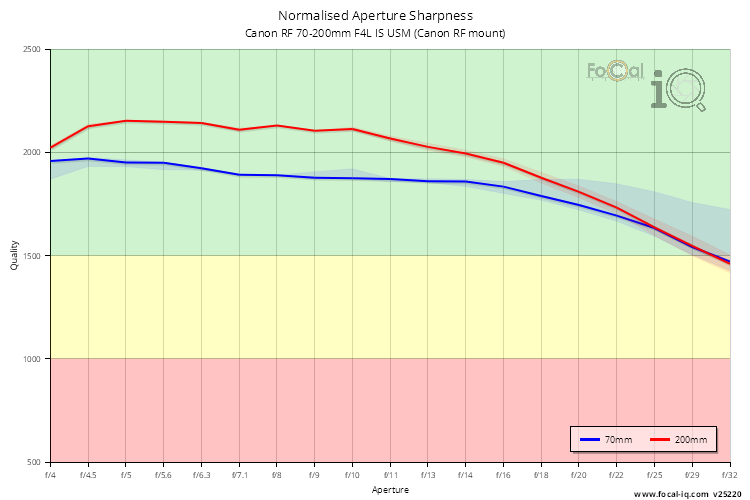
Aperture Sharpness Profile
| 70mm | 200mm |
|---|
| Wide Quality Change (vs best IQ) | -2.9% | -6.3% |
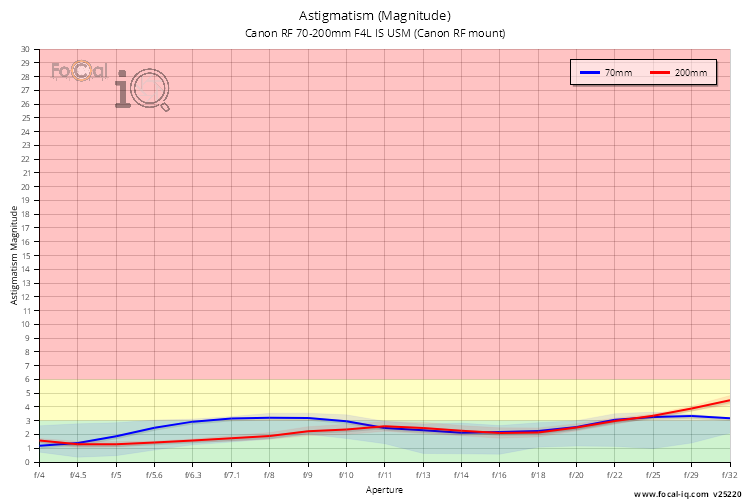
Astigmatism
| 70mm | 200mm |
|---|
| Astigmatism (wide) | 1.2% | 1.6% |
| Astigmatism (at best IQ) | 0.7% | 1.6% |
| Wide Astigmatism Change (vs best IQ) | +0.5% | -0.1% |
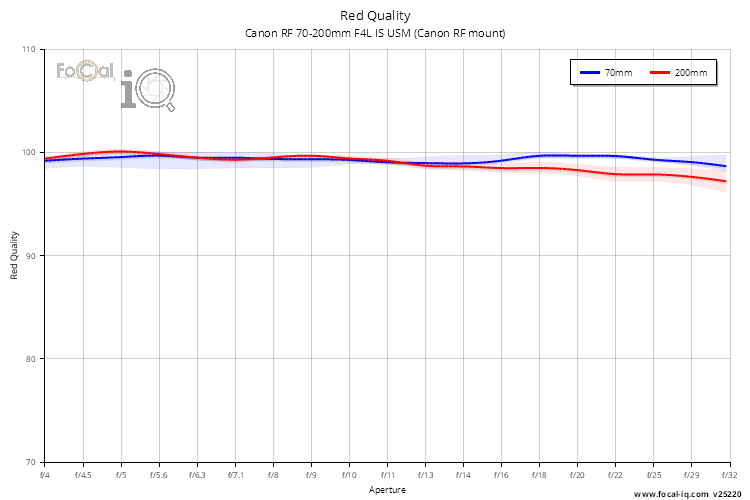
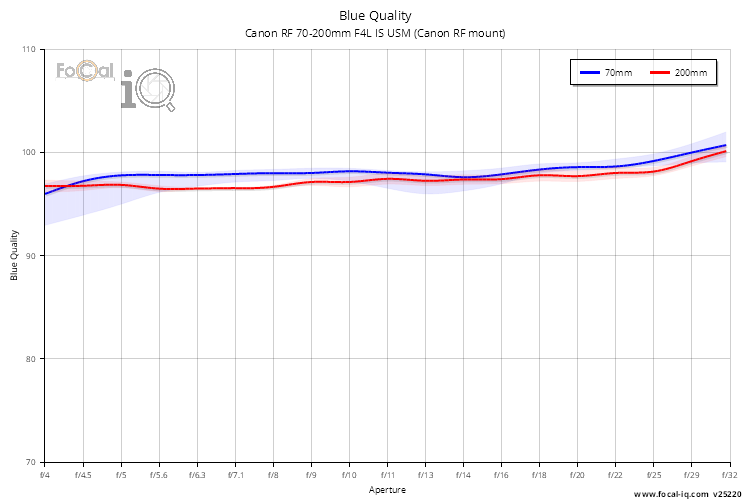
Red/Blue Quality
| 70mm | 200mm |
|---|
| Red Quality (wide) | 99.2% | 99.4% |
| Red Quality (at best IQ) | 99.0% | 100.4% |
| Wide Red Quality Change (vs best IQ) | +0.2% | -1.0% |
| 70mm | 200mm |
|---|
| Blue Quality (wide) | 96.0% | 96.7% |
| Blue Quality (at best IQ) | 97.2% | 97.2% |
| Wide Blue Quality Change (vs best IQ) | -1.3% | -0.5% |
Peak Performance Score 70mm | |
Peak Performance Score 200mm | |
The peak information shows the performance of the lens at the aperture of best image quality.
Summary
The summary information shows the metrics measured to build the score.
| 70mm | 200mm |
|---|
| Aperture Stops (Wide to Peak) | 0.3 | 0.6 |
| High Quality Apertures (to f/8) | 6 of 7 (86%) | 6 of 7 (86%) |
| Astigmatism (at best IQ) | 0.7% | 1.6% |
| Red Quality (at best IQ) | 99.0% | 100.4% |
| Blue Quality (at best IQ) | 97.2% | 97.2% |
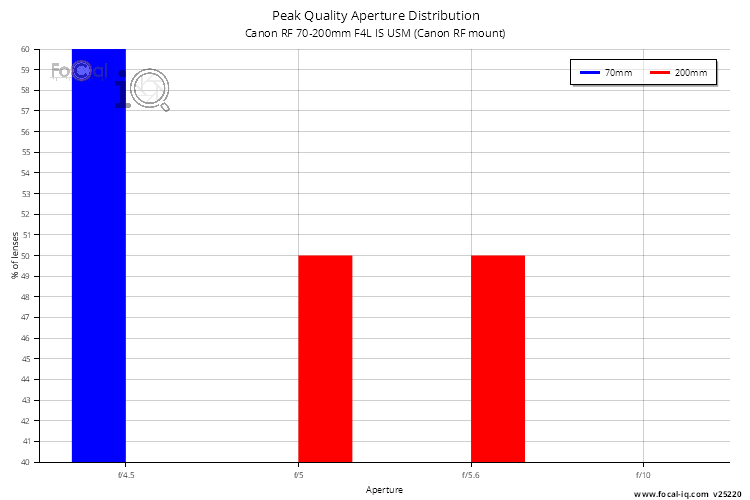
Peak Histo
| 70mm | 200mm |
|---|
| Peak Aperture Range | f/4.1 to f/9 | f/4.9 to f/5.5 |
| Typical Peak Aperture | f/4.5 | f/5 |
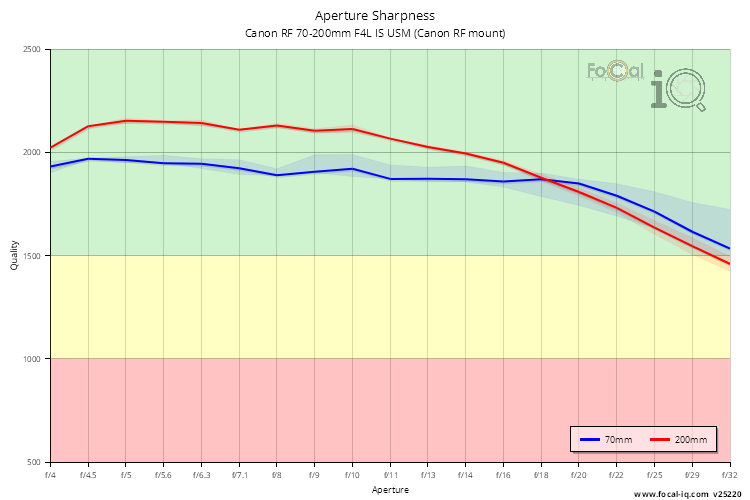
Aperture Sharpness Profile
| 70mm | 200mm |
|---|
| Aperture at Peak Quality | f/4.5 | f/5 |
| Peak Ouality Variation | 16.5% | 5.0% |
| High Quality Apertures (to f/8) | 6 of 7 (86%) | 6 of 7 (86%) |
Astigmatism
| 70mm | 200mm |
|---|
| Astigmatism (at best IQ) | 0.7% | 1.6% |
Red/Blue Quality
| 70mm | 200mm |
|---|
| Red Quality (at best IQ) | 99.0% | 100.4% |
| 70mm | 200mm |
|---|
| Blue Quality (at best IQ) | 97.2% | 97.2% |
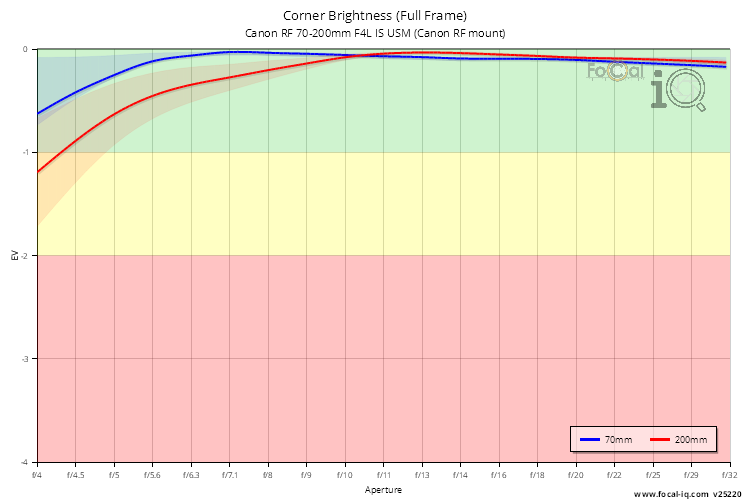
The vignetting information shows how the light is attenuated in the corners of the frame across the aperture range.
Summary
The summary information shows the metrics measured to build the score.
Full Frame
| 70mm | 200mm |
|---|
| Vignetting | -0.6 EV | -1.2 EV |
| Affected Stop Count | 2.0 | 2.9 |
Corner Brightness Profile
The aberrations information shows details of the astigmatism and colour quality changes across the aperture and focus range.
Summary
The summary information shows the metrics measured to build the score.
| 70mm | 200mm |
|---|
| Wide Aperture | f/4 | f/4 |
| Aperture at Peak Quality | f/4.5 | f/5 |
| 70mm | 200mm |
|---|
| Astigmatism (at best IQ) | 0.7% | 1.6% |
| Astigmatism (wide) | 1.2% | 1.6% |
| Wide Astigmatism Change (vs best IQ) | +0.5% | -0.1% |
| Median Astigmatism | 2.7% | 2.2% |
| 70mm | 200mm |
|---|
| Red Quality (at best IQ) | 99.0% | 100.4% |
| Red Quality (wide) | 99.2% | 99.4% |
| Wide Red Quality Change (vs best IQ) | +0.2% | -1.0% |
| Median Red Quality | 99.4% | 99.1% |
| 70mm | 200mm |
|---|
| Blue Quality (at best IQ) | 97.2% | 97.2% |
| Blue Quality (wide) | 96.0% | 96.7% |
| Wide Blue Quality Change (vs best IQ) | -1.3% | -0.5% |
| Median Blue Quality | 97.9% | 97.2% |
Quality
| 70mm | 200mm |
|---|
| Wide Aperture | f/4 | f/4 |
| Aperture at Peak Quality | f/4.5 | f/5 |
Astigmatism
| 70mm | 200mm |
|---|
| Astigmatism (wide) | 1.2% | 1.6% |
| 70mm | 200mm |
|---|
| Astigmatism (at best IQ) | 0.7% | 1.6% |
| Astigmatism (wide) | 1.2% | 1.6% |
| Wide Astigmatism Change (vs best IQ) | +0.5% | -0.1% |
| Median Astigmatism | 2.7% | 2.2% |
Red
| 70mm | 200mm |
|---|
| Red Quality (wide) | 99.2% | 99.4% |
| 70mm | 200mm |
|---|
| Red Quality (at best IQ) | 99.0% | 100.4% |
| Red Quality (wide) | 99.2% | 99.4% |
| Wide Red Quality Change (vs best IQ) | +0.2% | -1.0% |
| Median Red Quality | 99.4% | 99.1% |
Blue
| 70mm | 200mm |
|---|
| Blue Quality (wide) | 96.0% | 96.7% |
| 70mm | 200mm |
|---|
| Blue Quality (at best IQ) | 97.2% | 97.2% |
| Blue Quality (wide) | 96.0% | 96.7% |
| Wide Blue Quality Change (vs best IQ) | -1.3% | -0.5% |
| Median Blue Quality | 97.9% | 97.2% |
Prduction Quality Score 70mm | |
Prduction Quality Score 200mm | |
The physical quality information combines consistency and quality metrics to indicate the overall physical (electrical, mechanical and optical) quality and consistency of the lens.
Summary
The summary information shows the metrics measured to build the score.
| 70mm | 200mm |
|---|
| Typical Focus Adjustment Magnitude | Unknown | Unknown |
| Requiring Visually Significant Adjustment (4 or more units) | Unknown | Unknown |
| Focus Adjustment Variation | Unknown | Unknown |
| Calibration Quality Variation | Unknown | Unknown |
| Peak Ouality Variation | 16.5% | 5.0% |
| Aperture Change Image Motion | 1.4 μm | 2.3 μm |
| Focus Change Image Motion | Unknown | Unknown |
Focus Adjustment Profile
| 70mm | 200mm |
|---|
| Calibration Quality Variation | Unknown | Unknown |
Focus Adjustment Magnitude Distribution
| 70mm | 200mm |
|---|
| Typical Focus Adjustment Magnitude | Unknown | Unknown |
| Focus Adjustment Variation | Unknown | Unknown |
Aperture Sharpness Profile
| 70mm | 200mm |
|---|
| Peak Ouality Variation | 16.5% | 5.0% |
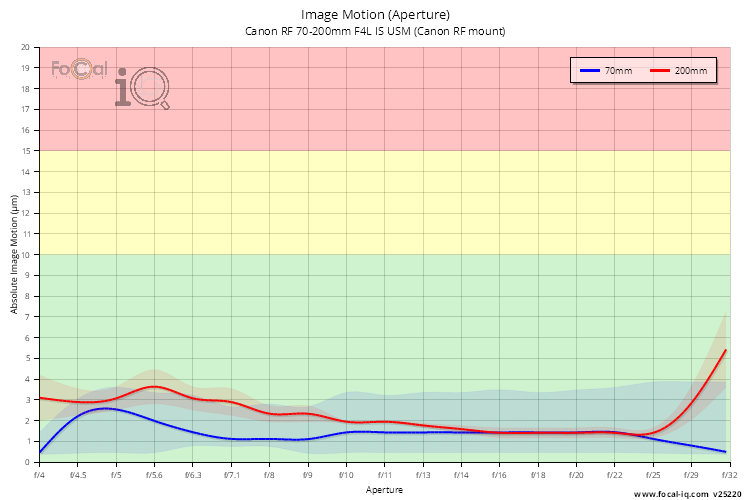
Image Motion
| 70mm | 200mm |
|---|
| Focus Change Image Motion | Unknown | Unknown |
| 70mm | 200mm |
|---|
| Aperture Change Image Motion | 1.4 μm | 2.3 μm |
Parfocality
| 70mm | 200mm |
|---|
| Parfocailty Variation | Unknown | Unknown |
Spotted an error or have feedback about the site? Contact us